AutoCarto-Agent
A cartography agent where the LLM proposes and 6 deterministic statistical gates dispose.
- 530Atlanta tracts in the worked case
- +0.326Bivariate Moran's I (p = 0.0050)
- 97.4%Gate decision accuracy on the seeded benchmark
- 6Deterministic validation gates
Problem
Ask a language model to make a thematic map and it will happily pick a classification scheme, a projection, and a color ramp. It has no way to know whether any of those choices are defensible. Quintile breaks on a zero-inflated distribution, a density calculated in a geographic CRS, a bivariate map of two variables that are not spatially coupled — these are all fluent, plausible, and wrong.
The interesting question is not “can an LLM make a map?” It is: which decisions should an LLM be allowed to make at all? AutoCarto-Agent answers it by drawing an explicit authority boundary. The model handles intent, framing, and language. Every numeric cartographic decision is either prescribed or vetoed by a deterministic gate.
Approach
The architecture is neuro-symbolic: a Propose → Verify → Execute loop where verification is not another model but a set of statistical tests with published thresholds.
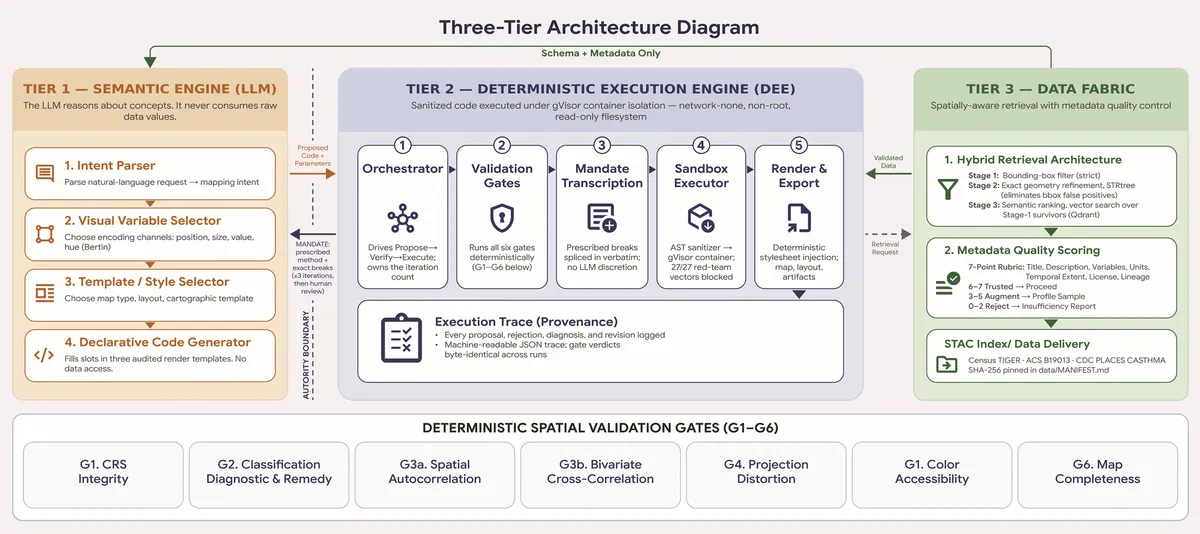
The critical design choice is that a gate never merely says no. Every rejection
carries a prescription — the exact method and the full-precision break values that would
make the proposal correct — and the orchestrator mandates that fix on the next iteration
rather than asking the model to guess again. This is enforced structurally: a REJECT
result without a prescription raises at construction time.
The six gates
| Gate | Question it answers | Statistic |
|---|---|---|
| 1 — CRS integrity | Is a density or rate about to be computed in degrees? | Equal-area EPSG whitelist per AOI scale |
| 2 — Classification | Does this classification actually fit the distribution? | Goodness of Variance Fit, threshold 0.6 |
| 3a — Univariate structure | Is there spatial structure worth mapping? | Moran’s I with permutation test |
| 3b — Bivariate justification | Are these two variables spatially coupled? | Bivariate Moran’s I, 199 permutations, Spearman ρ |
| 4 — Projection distortion | How much does this projection lie at this extent? | Areal and angular distortion |
| 5 — Color accessibility | Is the ramp readable for colorblind viewers? | Simulated dichromacy contrast |
| 6 — Completeness | Does the map have the elements it needs to be read? | Structural checklist |
Technical detail — how Gate 2 diagnoses rather than vetoes
Gate 2 characterises the raw distribution shape independently of whatever classification
was proposed: well_behaved, zero_inflated, heavy_right_skew, outlier_dominated,
discrete_ordinal, or insufficient_variance. Diagnosis dispatch runs before the GVF
check, and zero-inflation is tested before skew, because a distribution can trigger both
and the more specific diagnosis should win.
Each diagnosis maps to a mandated method — a manual break at zero then Fisher-Jenks on
the non-zero tail; a log1p transform with back-transformed breaks; arcsinh where
negatives make a log invalid; head-tail breaks for heavy tails; unique-value
classification for discrete ordinals. The prescription carries breaks at full precision
for the model to transcribe, with a human-readable version rounded to six significant
figures so a last-bit float difference across platforms cannot change behaviour.
Thresholds live in a single versioned registry with a rationale attached to each, so changing one is a one-line diff with a citable reason rather than an archaeology exercise through gate source files.
Results
The worked case is tree canopy loss against asthma hospitalisation across 530 census tracts in Fulton and DeKalb counties, Georgia, on real TIGER geometry.
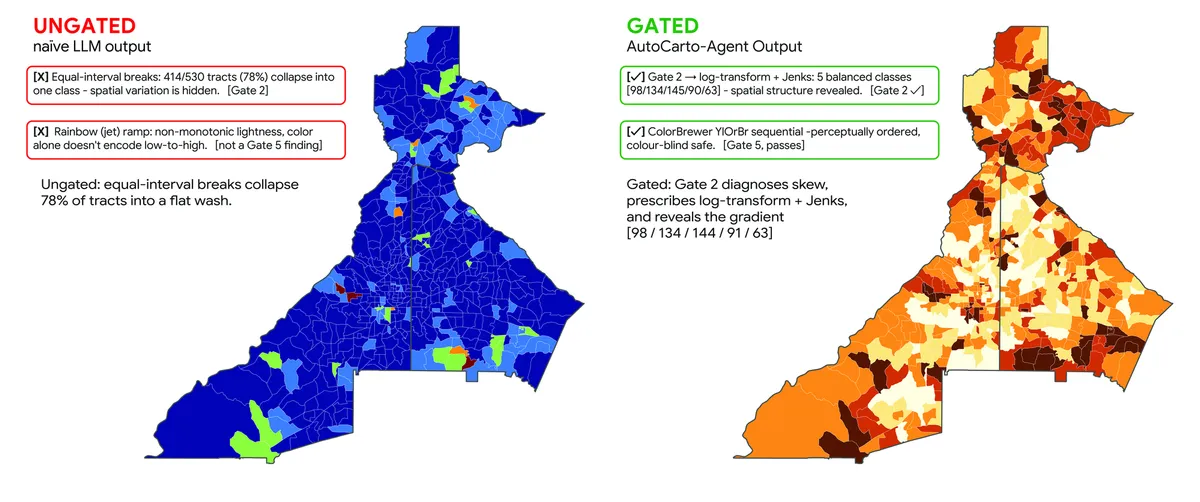

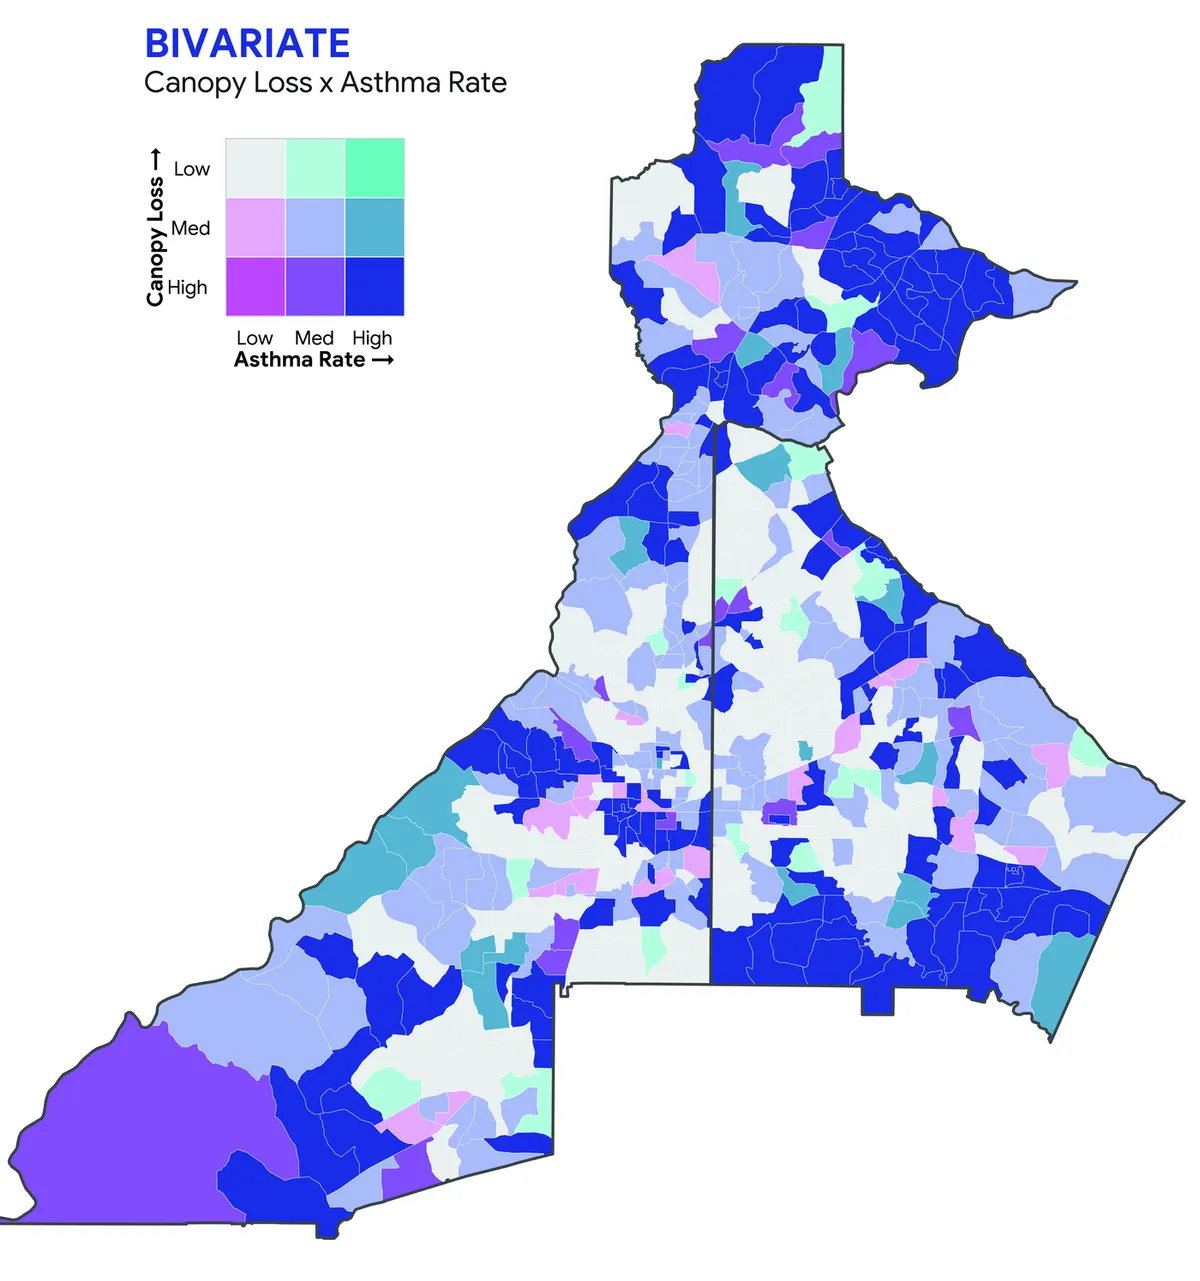
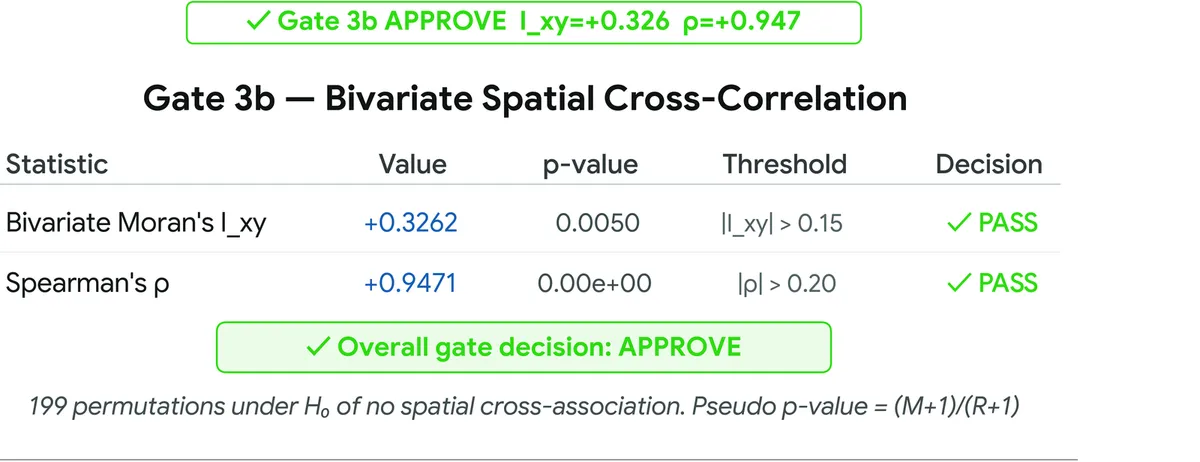
The loop, running end to end
The gates are not a paper design. These three maps are raw output from the agent driving the full Propose → Verify → Execute loop against a live Llama 3.1 70B tier — one map per natural-language prompt, typos and all, with the classification the gates settled on printed onto each figure.
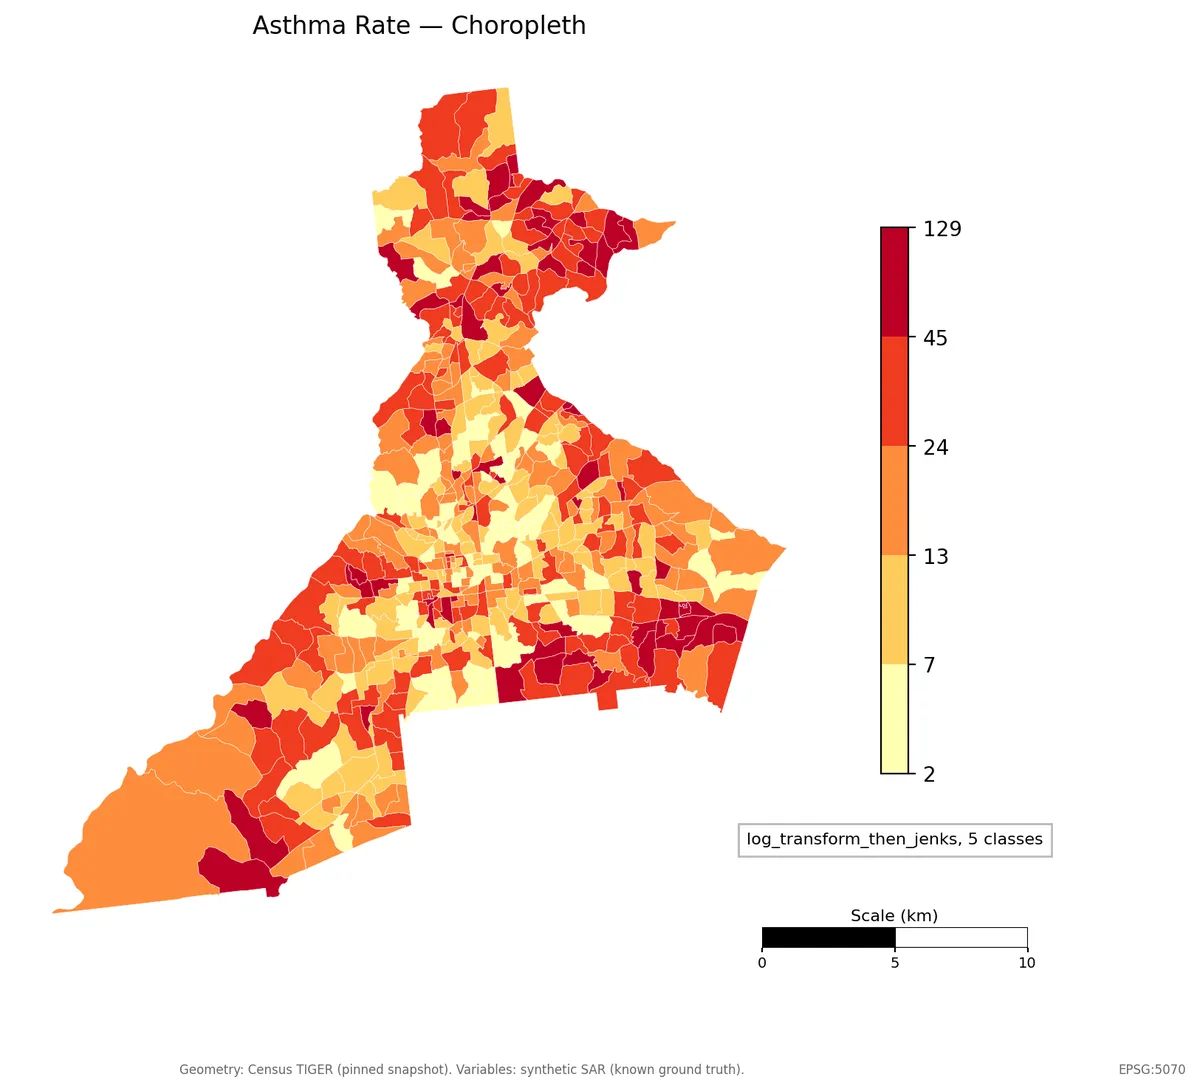
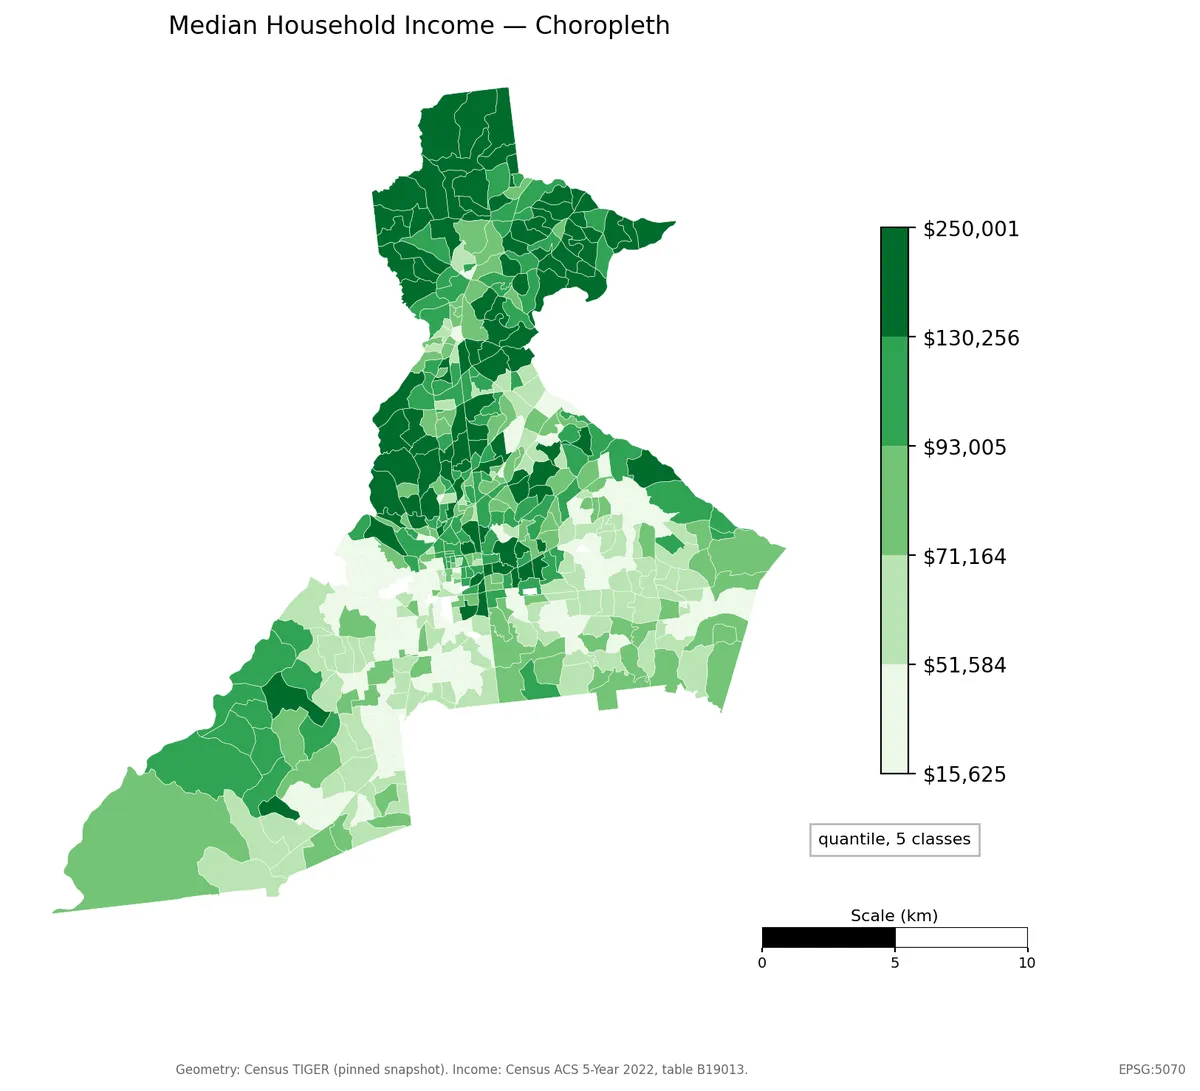
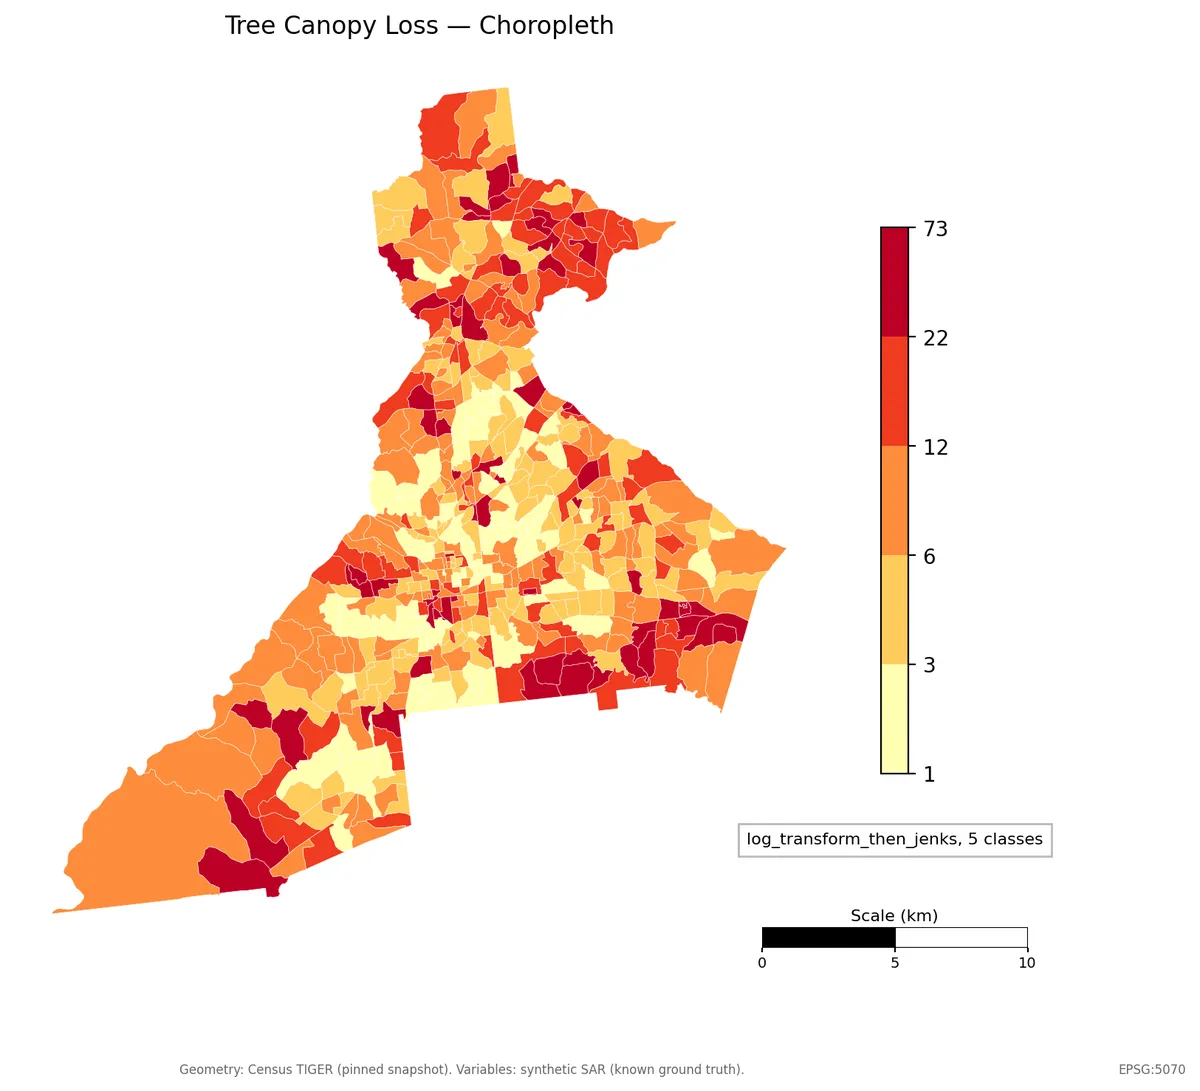
Every one of these carries a JSON execution trace recording the proposal, each gate verdict, and any mandated revision — which is what makes a rerun checkable rather than merely repeatable.
Does the validator actually decide correctly?
A rejection rate on its own means nothing — a gate that rejects everything scores well on it. So the benchmark is a seeded corpus with known ground-truth outcomes, and the headline number is decision correctness, not rejections.
Across 42 scenarios covering all six gates, the validator reaches 97.4% strict decision accuracy — 38 of 39 scorable scenarios, with 3 borderline cases reported but not scored. It is correct on 21 of 22 pathological scenarios and 17 of 17 benign ones.
The overall rejection rate is 52.4%, which is high by construction: the corpus is
deliberately adversarial, and two of its regimes are negative controls where rejection is
permanently correct rather than a fixable defect — white_noise has no spatial structure to
map, and independent has no coupling to justify a bivariate encoding. A rejection rate is
only meaningful quoted alongside that composition, which is why the committed report embeds
its own corpus description.
| Rejected by | Count |
|---|---|
| Gate 2 — heavy right skew | 6 |
| Gate 2 — zero inflated | 3 |
| Gate 2 — discrete ordinal | 3 |
| Gate 3a — white noise (negative control) | 3 |
| Gate 3b — independent (negative control) | 2 |
| Gate 3b — weak coupling | 1 |
| Gate 4 — Web Mercator at CONUS extent | 1 |
| Gate 4 — Web Mercator at state extent | 1 |
| Gate 1 — density in a geographic CRS | 1 |
| Gate 5 — red-yellow-green diverging ramp | 1 |
Earlier versions of this benchmark scored only Gates 2 and 3b; the current corpus exercises every gate, which is why both the scenario count and the accuracy figure moved.
What I would do next, and what is weak
One miss is worth naming: on an independently-generated scenario the bivariate gate approved an encoding it should have rejected — I_xy = +0.1965 at p = 0.005 with Spearman ρ = 0.2398. A statistically significant but substantively weak association passed a threshold tuned for stronger signal. That case is in the committed report rather than filtered out of it.
The threshold sensitivity analysis surfaced a second honest weakness: the
heavy_right_skew prescription clears the GVF floor only 82.5% of the time even when
applied correctly — the weakest of the five prescriptive regimes.
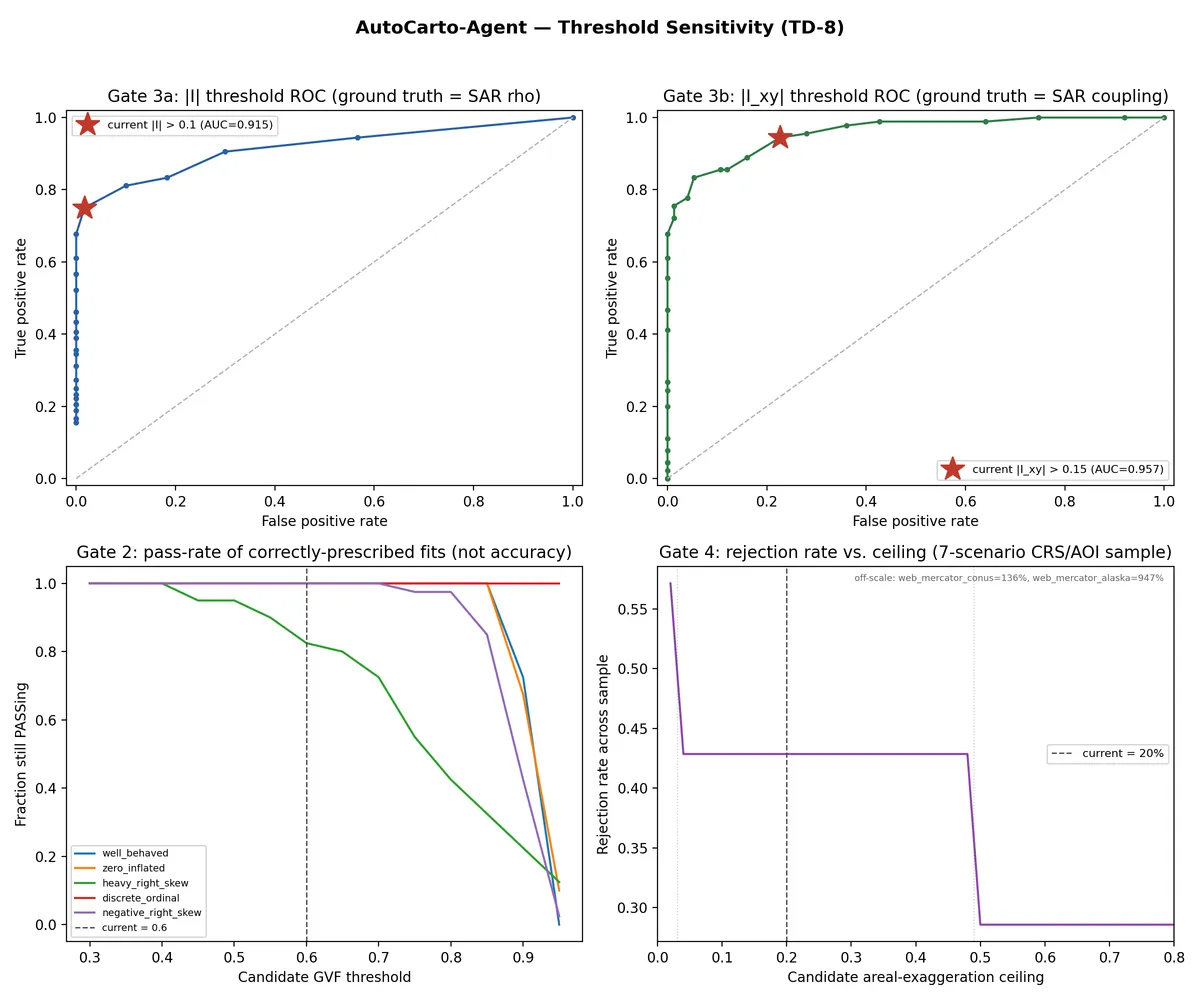
Next: a formal calibration sweep for the thresholds that are currently conventional rather than swept, and a second prescriptive regime for skewed distributions where the log transform underperforms.
Reproducibility
The core loop runs fully offline and seeded by default — no API key, no network, no Docker. Rerunning the demo reproduces the statistical trace content byte for byte, and the test suite compares against blessed traces committed in the repository.
pip install -e .[dev]
autocarto demo         # deterministic demo → ./output
autocarto benchmark    # rejection-rate report → ./benchmarks
pytest                 # ~215 tests: gates, orchestrator, determinism, security
CI runs on every push across Linux and Windows × Python 3.12 and 3.14, plus a dedicated gVisor security job. The execution sandbox — non-root, no shell, network-isolated — was red-teamed against 27 escape vectors, and air-gapped mode was verified to open zero sockets.
Presented as a poster at the Spatiotemporal Data Science Symposium (STDS) 2026.
Share this page
https://abdulkalam.pages.dev/projects/autocarto-agent/
Scan to open this page. Download the SVG for print.
