FloodOps
Which facilities and roads go under at each of 21 coastal water levels, across 8 NJ towns.
- 8NJ municipalities covered
- 21Water levels, 0–20 ft above MHHW
- 7 of 8Towns passing the tidal-datum gate
- 0.5 ftDepth precision, matched to its error budget
Problem
Rutgers publishes a statewide coastal inundation model for New Jersey: 21 whole-foot water levels, 0 to 20 ft above Mean Higher High Water, as polygons. It tells you where the water goes. It does not tell you what the water reaches.
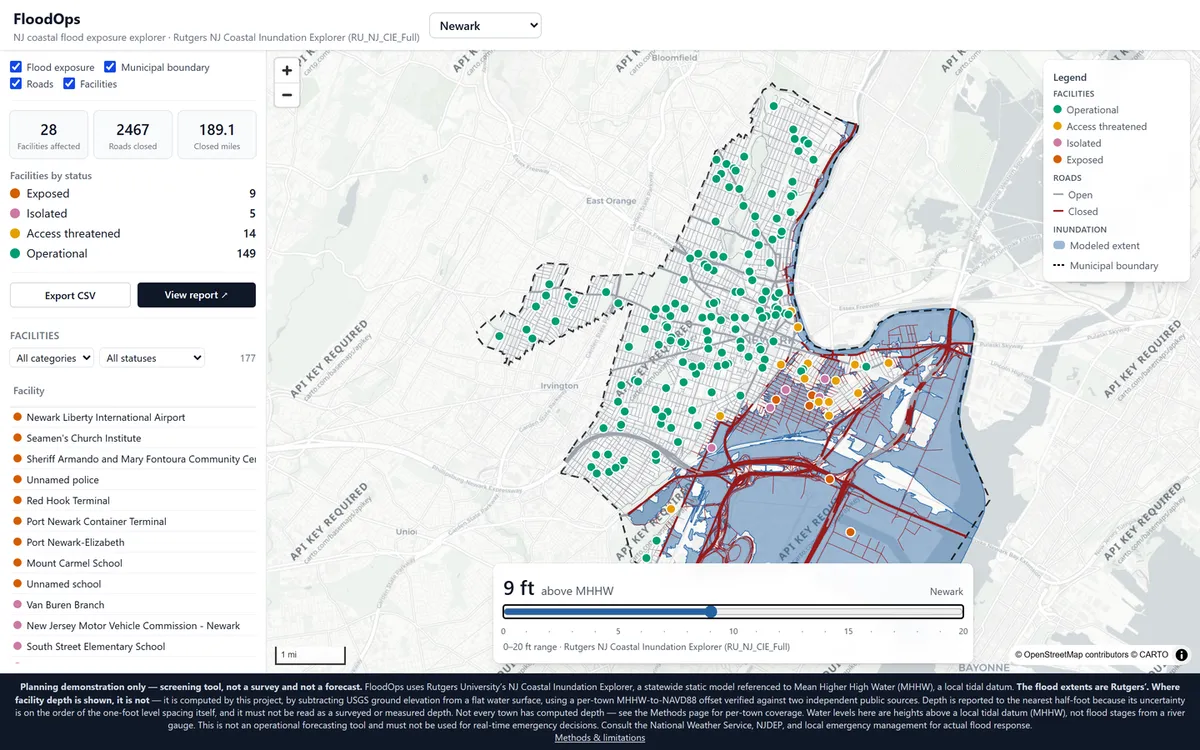
An emergency manager does not need a polygon. They need the list — which fire stations, which schools, which hospitals, which roads, at which level, and which facility loses its access before it ever takes on water. FloodOps turns the published hazard extent into that list, for eight coastal and tidal municipalities, one town and one level at a time.
Approach
The hazard model is Rutgers’. Everything layered on top of it is this project’s own inference, and the whole design turns on keeping that seam visible.
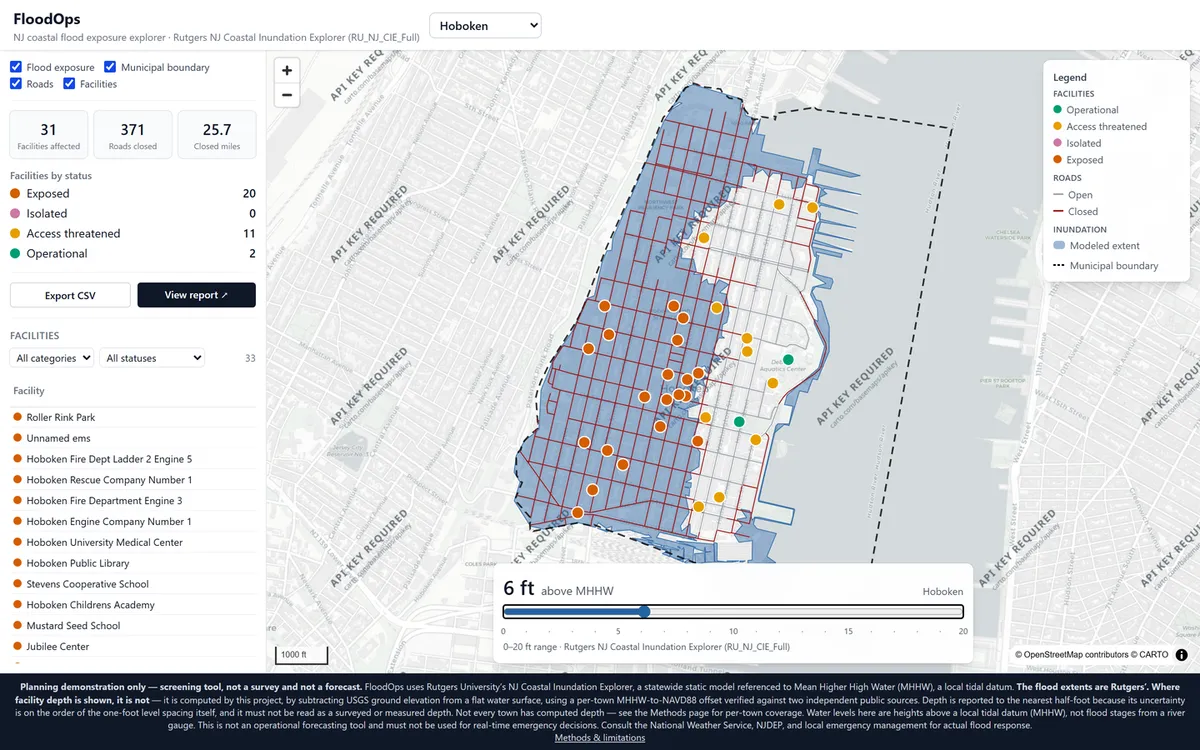
Facility status is computed from extent membership first — whether the facility’s point falls inside the level’s modeled footprint, with a 20 m tolerance for alignment between OSM points and an independently produced hazard polygon. Towns with a verified tidal datum get a four-tier model (exposed / isolated / access-threatened / operational); towns without get a three-tier one. Roads are two-tier, open or closed, in every town — a graded “caution” tier would have to be depth-derived, and road segments never get a computed depth.
Access loss is the rule that makes the tool operational rather than cartographic: a facility is isolated when every road segment within 120 m of it is closed. A dry building you cannot reach is not a working building.
The datum problem, and the gate it produced
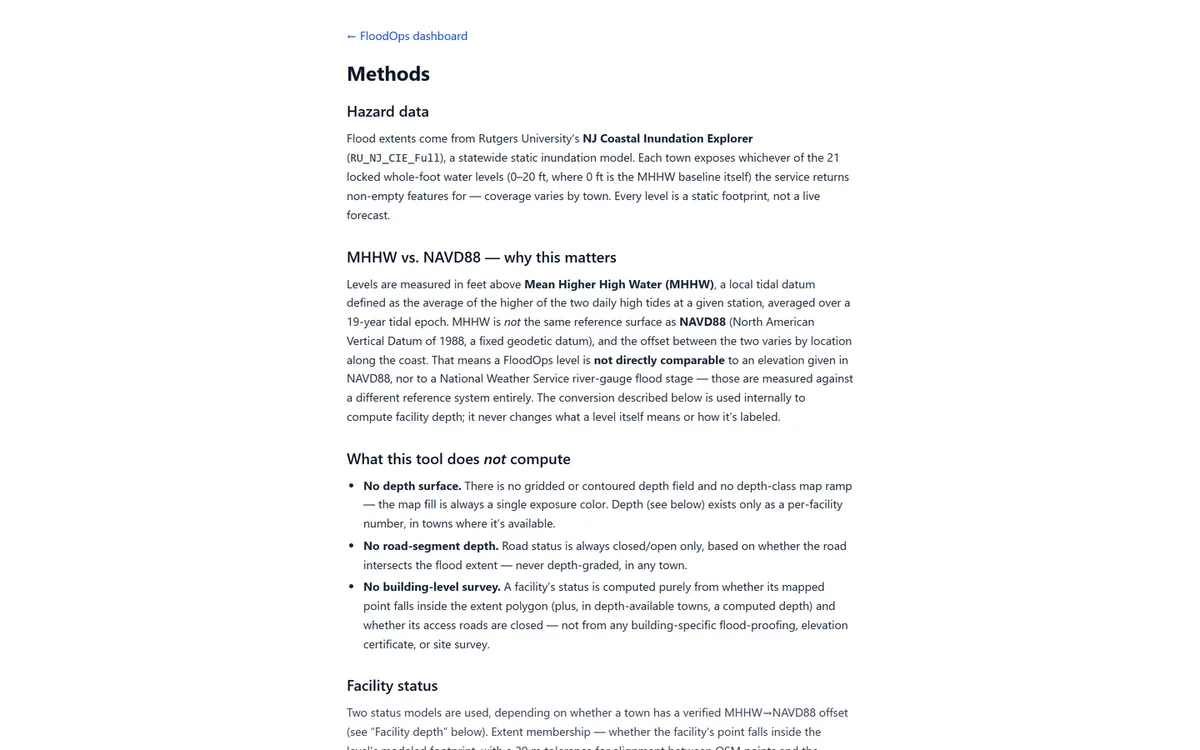
Levels are given in feet above MHHW, a local tidal datum — the average of the higher daily high tide over a 19-year epoch. Ground elevation from USGS 3DEP comes in NAVD88, a fixed geodetic datum. The offset between them varies along the coast. Subtract one from the other without reconciling the two and you get a depth number that is confidently wrong.
So depth is gated on the datum, not assumed from it. Each town’s MHHW→NAVD88 offset is resolved from two independent public sources — a NOAA VDatum point conversion inside that town’s own flood extent, and the nearest NOAA CO-OPS tide station with a published NAVD88 datum. The two must agree within 0.25 ft or the town ships no depth at all. No averaging, no picking the more convenient value.
Seven of eight towns pass. Camden does not, and keeps the extent-only model rather than shipping a number that could not be verified. That is the result, not a gap in it.
Technical detail — the depth model and its error budget
For towns that clear the datum gate, depth at a facility point is:
WSE (NAVD88 ft) = MHHW offset (NAVD88 ft) + level (ft above MHHW)
depth (ft)      = max(0, WSE − ground elevation)
Three deliberate constraints on that number:
- Reported at 0.5 ft precision only. Combined uncertainty — 3DEP accuracy, the offset approximation, and Rutgers’ extent having been produced from a different elevation model than this one — is on the order of the 1 ft spacing between levels. Reporting finer would claim a precision the method does not have.
- Outside the extent, depth is exactly 0 — never computed from the raw elevation difference. The published extent stays the sole authority on whether a facility is exposed at all; this project’s arithmetic never overrides it.
- The disagreement is published, not smoothed. A facility can sit inside Rutgers’ extent while this project’s own subtraction returns exactly 0 — two independently produced models disagreeing at the margin. The validator records how often that happens per town and level, and any town/level above 25% of exposed facilities becomes a named limitation.
The 1.0 ft first-floor offset that separates exposed from access-threatened is a
uniform assumption applied to every facility regardless of category. It is the single
largest lever in the model, and the methods page says so in those words.
Output
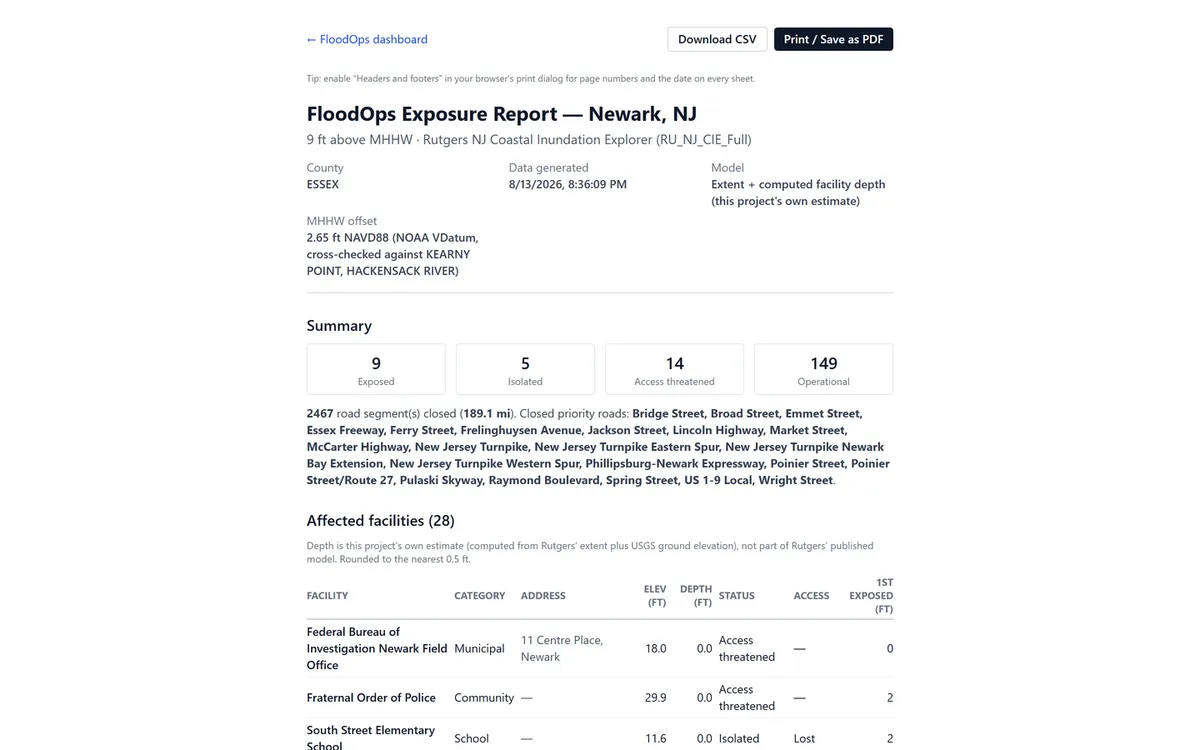
Each town and level produces a printable operations report and a CSV export that match the on-screen numbers exactly — the deliverable an emergency manager actually forwards, rather than a screenshot of a dashboard.
Architecture and limits
Everything is precomputed and static: a Python pipeline resolves the ArcGIS layer for each town and level by matching layer names at runtime rather than hardcoding IDs, filters server-side by municipality, unions the main and low-lying extents, simplifies the geometry (Newark’s 2 ft extent alone is ~9,400 vertices before simplification), samples facility elevations from USGS EPQS, and publishes per-town and per-level JSON that the app reads directly. There is no server-side geoprocessing and no runtime API call.
Two limits worth stating plainly. The hazard model is a static bathtub inundation footprint, not a forecast — it carries no timing, no duration, and no hydraulic routing. And the dataset itself reaches only the tidal third of the state: roughly 235 of New Jersey’s 564 municipalities appear in it at all. A town’s absence from FloodOps means the coastal model does not represent it, which is not the same as that town being safe.
Data sources
| Dataset | Source |
|---|---|
| Coastal inundation extents | Rutgers NJ Coastal Inundation Explorer (RU_NJ_CIE_Full) |
| Municipal boundaries | Census TIGERweb County Subdivisions |
| Facilities and roads | OpenStreetMap via Overpass |
| Ground elevation | USGS 3DEP, Elevation Point Query Service |
| Tidal datum offsets | NOAA VDatum (primary) + NOAA CO-OPS station datums (check) |
Planning demonstration only — not a survey and not a forecast. Not for real-time emergency decisions; consult the National Weather Service, NJDEP, and local emergency management.
Share this page
https://abdulkalam.pages.dev/projects/floodops/
Scan to open this page. Download the SVG for print.
