India Urban Heat Dashboard
Dangerous heat across 50 Indian cities on one screen, from 2 batched API calls.
- 50Cities tracked, population-weighted
- 46 °CSevere-heatwave alert threshold
- 2Batched API calls, replacing 86 sequential
- 3Years compared in the same view
Problem
India’s pre-monsoon season regularly pushes dozens of cities past 45 °C. The public dashboards that exist tend to show either a single map of state-level warnings or a long list of city temperatures — rarely both, and almost never with historical context or population weighting in the same view.
I wanted one screen that answers four questions in under ten seconds:
- Where is it hottest right now, at both city and state scale?
- How many people are exposed to dangerous heat?
- Is today unusual compared with recent years?
- Which cities crossed the severe-heatwave threshold?
Approach
A static HTML and JavaScript page with no backend, no build step, and no API key — so it stays shareable as a link indefinitely.
| Source | Product | Vintage | Access |
|---|---|---|---|
| Open-Meteo Forecast API | Current temperature, relative humidity, daily max, past-24h hourly | Live | Free, no auth, batched multi-point requests |
| Open-Meteo Archive API | ERA5 reanalysis daily maxima for the same week in prior years | Live | Free, no auth |
| jbrobst India States GeoJSON | 36 state and union-territory boundaries, ST_NM property | Retrieved 2026-08-06 | Vendored into this site, not hotlinked |
| Curated city list | 50 heat-prone cities with baked-in coordinates and population | Committed | public/labs/heat-dashboard/js/cities.js |
Three encodings, three variables
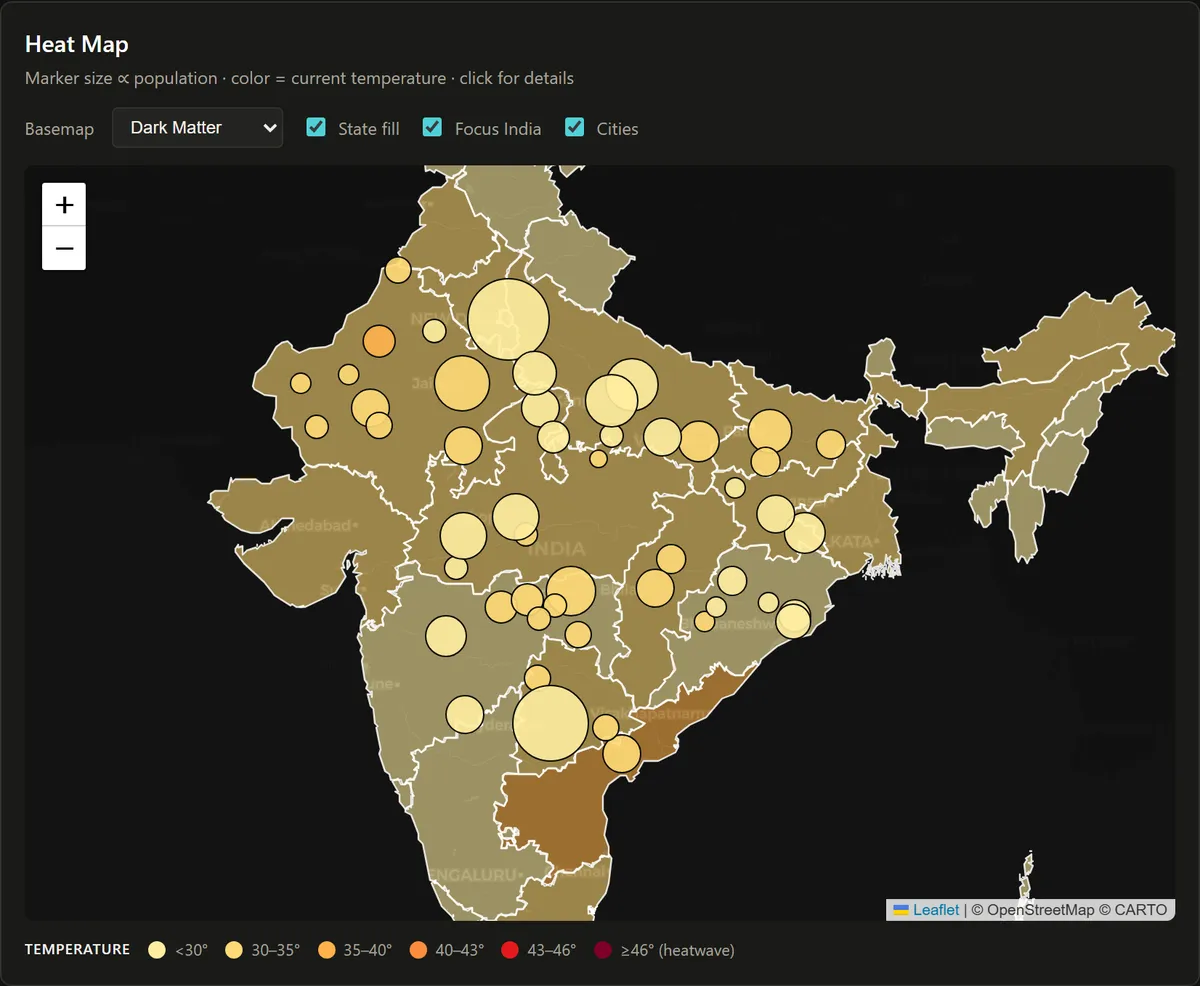
The map layers three encodings, and the discipline is that no two carry the same variable — every channel earns its place.
| Encoding | Variable | Why this channel |
|---|---|---|
| State polygon fill | Current temperature at a representative point per state | Color is the fastest channel for ordinal data; regional patterns appear immediately |
| Marker color | Current temperature at the city | Same scale as the fill, so the palette is learned once |
| Marker radius (√-scaled) | City population | Size answers “how many people are under this dot” |
| Popup | Humidity, today’s peak, 24-hour change, population | Detail on demand keeps the canvas uncluttered |
Technical detail — the India mask and deterministic layer order
Figure-ground without a caption. One L.polygon whose outer ring is the world
rectangle and whose holes are every state’s outer ring, rendered with
fillRule: "evenodd" in the page background color. Pakistan, Sri Lanka, Bangladesh, and
the rest of Asia dissolve into the page; India becomes the unambiguous figure. It is
toggleable, but the default tells the story.
Z-order as a declaration, not a side effect. Adding the choropleth and mask produced
a classic stacking bug: markers were sometimes obscured by the state fill, sometimes by
the mask, depending on which layer rendered last. bringToFront/bringToBack worked but
was fragile across refreshes. The fix was four explicit Leaflet panes with assigned
z-indices:
tile (200) < choroplethPane (350) < maskPane (360) < outlinePane (370) < markers (400)Layer order became a property of the map, not an accident of render timing. This is the pattern I now reach for first on any layered map.
The 46 °C threshold
The India Meteorological Department’s formal severe-heatwave definition for the plains is a departure of +6.4 °C from normal, which is not computable live without a normals surface. 46 °C is the practical proxy that news outlets use, and it is defensible to explain. It drives four things at once: the red banner, the row highlight in the table, the dedicated alert panel, and a white border on the map marker.
The palette is a six-bin scale keyed to heat-health thresholds rather than to aesthetics, with purple deliberately off the warm ramp at ≥ 46 °C so severe cases pop rather than blend. The same six bins are reused on markers, choropleth, table cells, popup headers, and history bars — learned once, applied everywhere.
Results
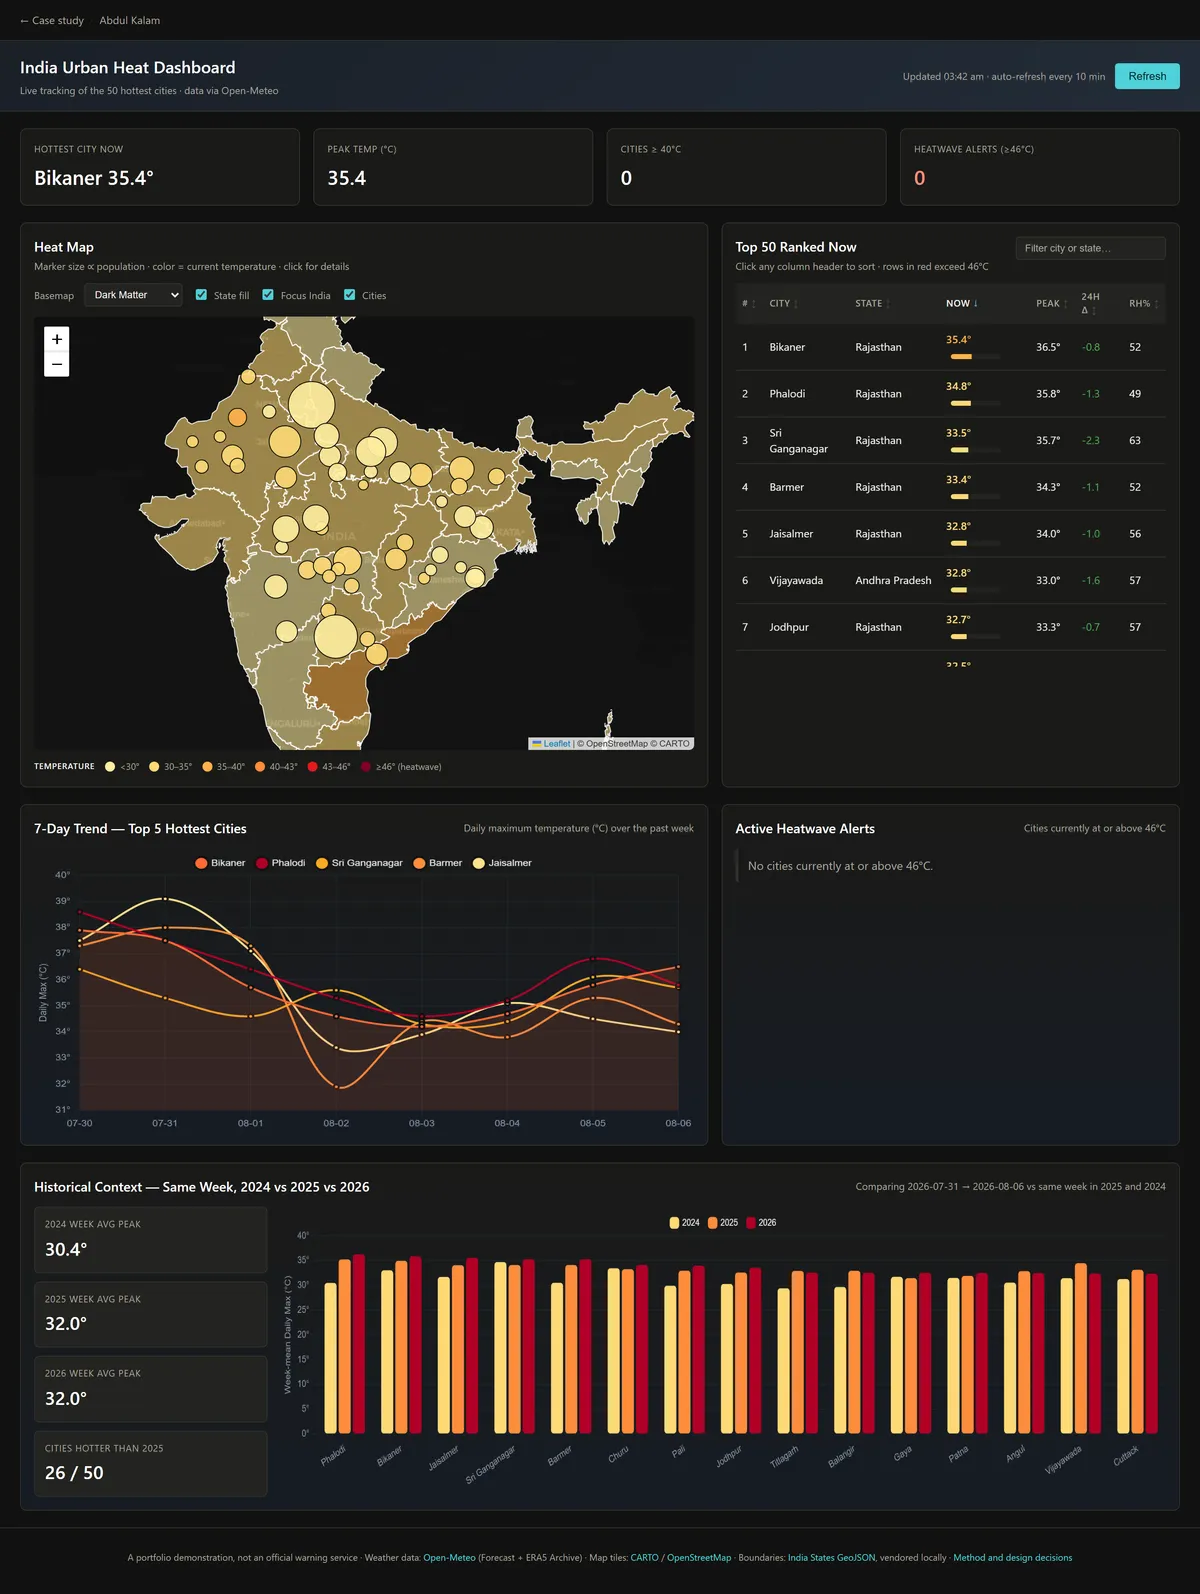
The four-KPI row was the single biggest usability win — it gives the page a “you are here” anchor that frames everything below it.
Performance discipline mattered more than expected. Two batched requests replaced 86 sequential ones: one for all 50 cities, one for all ~36 state centroids. That is the difference between a page that renders immediately and one that visibly crawls.
The toggles came from realising the map is really five separable views in one — basemap, choropleth, mask, outline, markers. Letting the viewer compose their own combination respects their analysis without overloading the default state.
Accessibility work is partly hidden in the basemap dropdown: Positron and Esri Light Gray give the warm temperature palette its highest contrast, which matters for low-vision and colorblind viewers, since the blue-to-purple ramp reads more cleanly against a near-white base. Color is never the only channel — the table pairs numbers with colored bars, the alert system uses a banner with explicit text, and popups always list numeric values beside the color.
Limitations and what I would do next
Curating 50 cities buys predictable load and baked-in population at the cost of ever discovering an unexpectedly hot city outside the list. One representative point per state is a real simplification: an area-weighted state average would need roughly ten sample points per state. And Open-Meteo gives me ERA5 and GFS but not IMD’s official “heatwave declared” flag, which has rules beyond raw temperature.
Next, in order of value: an anomaly view coloring cities by departure from the 1991–2020 normal rather than by raw temperature — that reframes “hot” as “unusual”, which is the more useful question; a wet-bulb overlay, because the human-mortality story is wet-bulb, not dry-bulb; and a time slider to scrub through the past week.
Reliability
The dashboard is live, so it has to degrade honestly. If Open-Meteo is unreachable, every request falls back to a committed snapshot and the page says so in a banner and in the header — “Snapshot data · as of <date>” — rather than rendering stale numbers as though they were current. One upstream failure flips the whole page to snapshot mode, so it is never half-live and half-cached.
Leaflet, Chart.js, and the boundary GeoJSON are served from this domain rather than a CDN, so the tool does not break when someone else’s host does.
Share this page
https://abdulkalam.pages.dev/projects/india-urban-heat-dashboard/
Scan to open this page. Download the SVG for print.
