Impact of Proximity to Pedestrian-Heavy Areas on Crash Rates
Overlaying 1,000-ft pedestrian buffers on 13 years of NYC crash data to flag 11 intersections.
- 1,000 ftBuffer radius around every school and park
- 13Years of NYC crash data analyzed, 2012–2024
- 11Priority intersections identified for safety intervention
- 6Milestones completed in the certificate program
Problem
Schools, parks, and community centers concentrate pedestrians — which means they also concentrate the conflicts between pedestrians and vehicles. The question this project asked: does proximity to these pedestrian-heavy areas actually predict where severe pedestrian and cyclist crashes happen in Midtown Manhattan, and if so, precisely where should the city intervene first?
Approach
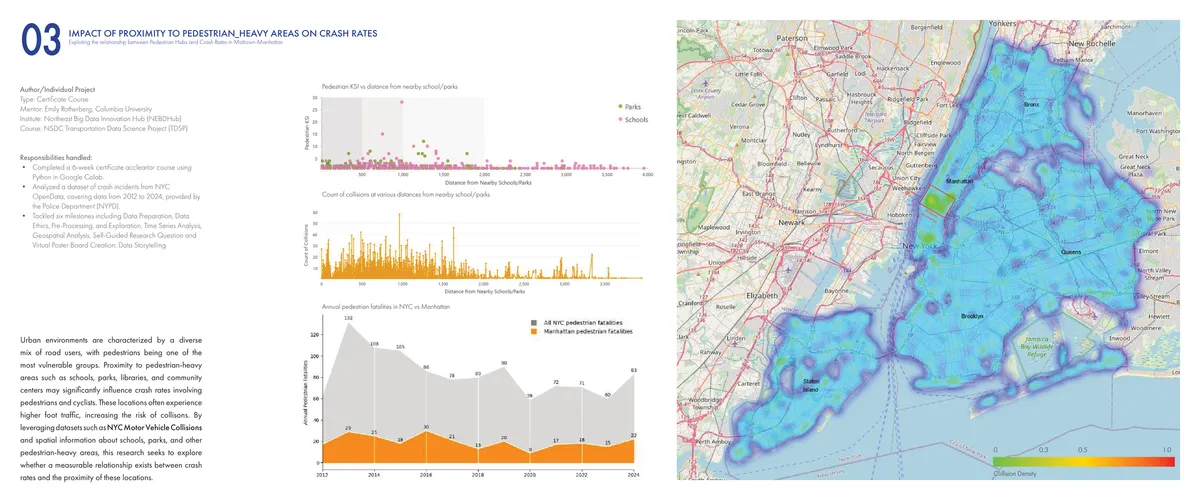
Using NYC Motor Vehicle Collision data covering 2012 to 2024, I mapped every school and park in Midtown Manhattan with a 1,000-foot buffer to define pedestrian-heavy zones, then overlaid pedestrian KSI (killed or severely injured) incidents against those buffers to test the proximity hypothesis directly.
Technical detail — from buffer to priority list
The workflow moved through three explicit spatial steps rather than one combined query, so each stage could be checked on its own:
- Map pedestrian-heavy zones. Schools and parks (parks above 0.5 acres) geocoded and buffered at 1,000 feet, producing a contiguous zone across most of Midtown.
- Map KSI incidents inside those zones. Point locations sized by fatality count, revealing concentration at specific intersections and corridors rather than uniform risk.
- Overlay the two to rank intersections by where crash severity and pedestrian activity actually converge — not just where either one is high alone.
Six certificate-program milestones structured the work: data preparation, data ethics, pre-processing and exploration, time-series analysis, geospatial analysis, and a self-guided research question with a virtual poster board for data storytelling.
Results
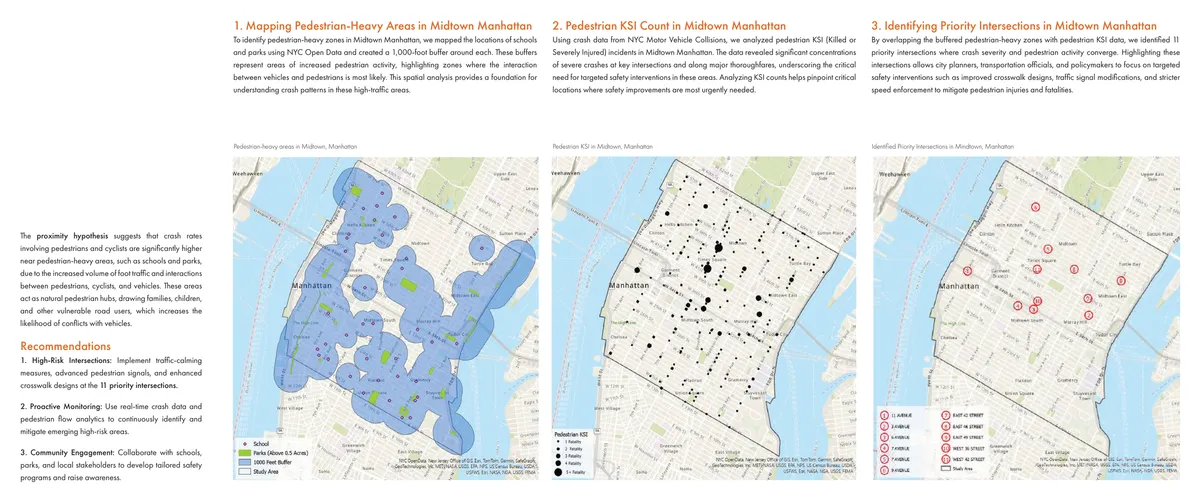
The 11 identified intersections span both avenues and cross streets rather than clustering on one corridor, which argues against a single-corridor fix and for intersection-specific countermeasures: traffic-calming, advanced pedestrian signals, and enhanced crosswalk design, backed by proactive monitoring as new crash data arrives.
What I’d do differently
The buffer is uniform at 1,000 feet regardless of a school’s enrollment or a park’s foot traffic. Weighting the buffer by a proxy for actual pedestrian volume — rather than treating every school and park as an equal generator — would sharpen the priority list further.
Share this page
https://abdulkalam.pages.dev/projects/pedestrian-crash-rates-manhattan/
Scan to open this page. Download the SVG for print.
