Flood Vulnerability Mapping, Woodbridge Township
Identifying 163 parcels still threatened by flooding after a 1,300-household buyout.
- 215Acres in the Watson-Crampton study neighborhood
- 163Land parcels mapped as threatened by future flooding
- 1,300Households removed from flood-affected areas by NJ Blue Acres
- 120Acres rezoned to open-space conservation
Problem
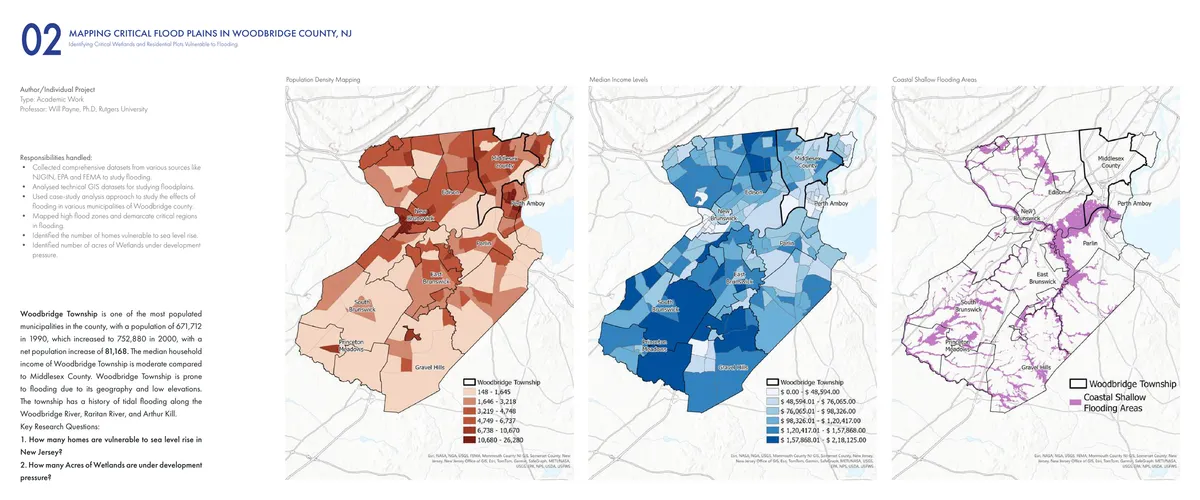
Woodbridge Township is one of the most populated municipalities in Middlesex County, New Jersey, and it is prone to flooding by geography and elevation, with a documented history of tidal flooding along the Woodbridge River, Raritan River, and Arthur Kill. After Superstorm Sandy in 2012, the state’s Blue Acres program removed roughly 1,300 households from the flood-affected Watson-Crampton neighborhood, converting 120 acres of acquired properties and existing marshland from residential zoning to Open Space Conservation/Resiliency Zone. The questions this project set out to answer: how many homes are still vulnerable to sea-level rise, and how many acres of wetlands remain under development pressure?
Approach
Working independently, I pulled comprehensive datasets from NJGIN, EPA, and FEMA to study flooding across the county, then used case-study analysis to compare how flooding plays out across Woodbridge’s constituent municipalities — mapping population density, income, and coastal shallow-flooding exposure against each other to see where vulnerability and capacity to respond diverge.
| Source | Product | Access |
|---|---|---|
| NJGIN | Statewide GIS layers | Public download |
| FEMA | Flood hazard and inundation data | Public |
| EPA | Environmental datasets used to study flooding effects | Public |
Results
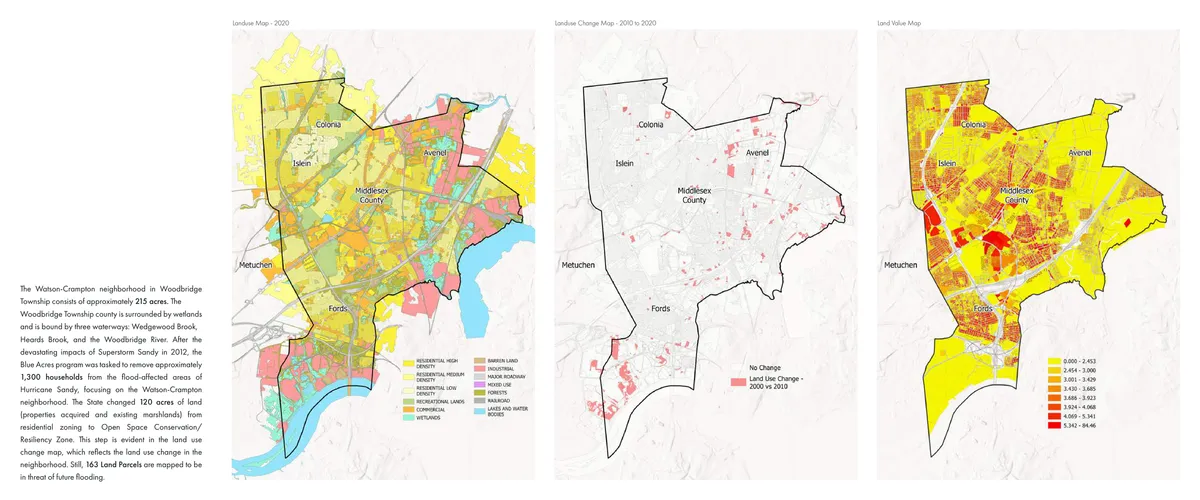
The 215-acre Watson-Crampton neighborhood — bound by Wedgewood Brook, Heards Brook, and the Woodbridge River — is the clearest case of the buyout program’s limits. The state converted 120 acres to conservation, but 163 land parcels are still mapped as in danger of future flooding from sea-level rise and inundation, and the analysis separately found 93.8% of critical wetlands in the township under extreme commercial and residential development pressure.
What I’d do differently
A parcel-level cost comparison — what it would cost to acquire the remaining 163 parcels against their current assessed value and repeated flood-claim history — would turn this from a risk map into a prioritization tool a municipality could actually fund against.
Share this page
https://abdulkalam.pages.dev/projects/woodbridge-flood-vulnerability/
Scan to open this page. Download the SVG for print.
